Roughly two months ago I wrote about the “Mag 7” stocks, focusing on three main technical factors when evaluating a stock – trend, momentum, and relative strength. You can read my old post here: https://dash-charts.com/2024/02/25/mag-7-still-struggling/
Over the past few months, and especially since the start of the year, many “Magnificent 7” or “Mag 7” stocks have been struggling with at least one of these three factors. The weakness continues to persist as we cycle through the spring season.
It seems as though these infamous market leaders have started to appear as the “Lag 7” rather than the “Mag 7.”
Let’s break down some trends and relative strength. Those are the two factors I will focus on today.
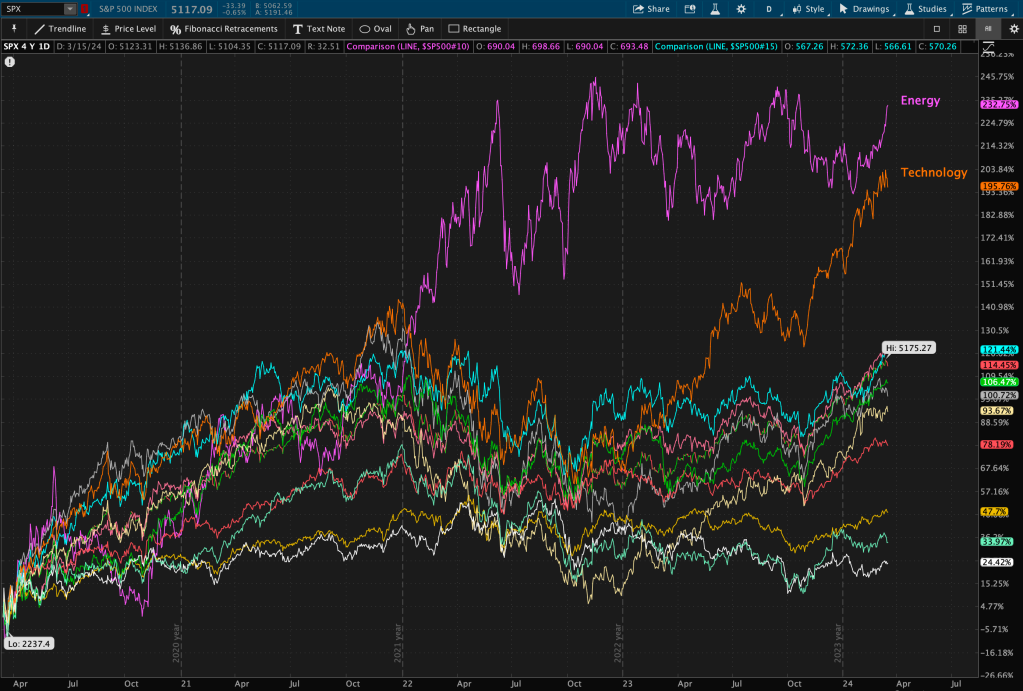
First, using ratio analysis with the S&P 500 Index as the benchmark, over the last six months, you can see the relative trend with each market leader when compared to the market.
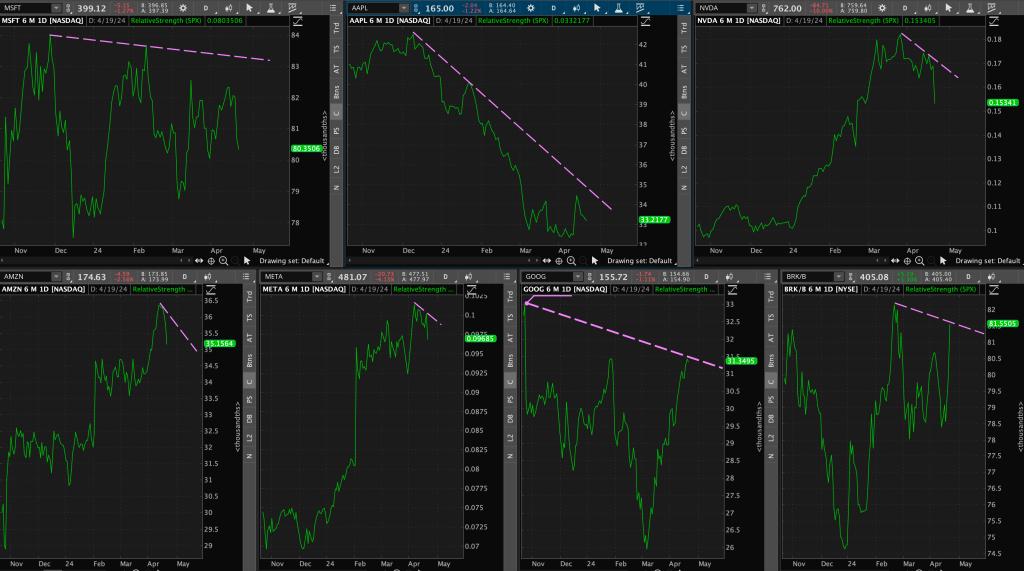
Microsoft ($MSFT) has been in a sideways to downward relative strength trend, Nvidia ($NVDA) topped out almost two months ago, Alphabet ($GOOG) has been in a downtrend but at resistance.
Amazon ($AMZN) and Meta Platforms ($META) have been making higher highs and higher lows, but experiencing recent weakness. Berkshire Hathaway ($BRK.B) looks like a mess.
Lastly, Apple ($AAPL) – this old market darling has fallen off a cliff into its relative strength grave.
What does this all mean?
These leaders are all currently underperforming the market and will continue to do so if their relative trend persists.
Now onto trends – the fun part. The two main themes from this past week are 1) failed breakouts, and 2) support hugs.
1. $MSFT
Microsoft, our mega-cap leader, appears to have experienced a failed breakout and swiftly cascaded down to support around $400.

The market seems to find this round number significant and relevant – as this level has been touched multiple times over just the past three months. Talk about a stage 5 clinger.
How many times is Microsoft going to try to hug this level going forward?
2. $AAPL
Apple forms some lovely price patterns. It always has.
Roughly a month and a half ago, I began to notice that $AAPL was forming a possible Double Top (bearish reversal) pattern. Read my old post here: https://dash-charts.com/2024/03/09/what-happens-next/

This week appeared to result in a completion of that pattern. Most technical investors/traders will wait for “confirmation,” which is typically a 1-3% move below its neckline, or support level.
The downside target is the depth of the pattern from peaks to neckline (about $34) subtracted from the neckline support level – which places the downside price objective near $131.
3. $NVDA
This has been an interesting and exhilarating stock to analyze over the past year.

After its massive Bearish Engulfing candlestick pattern at all-time-highs (ATHs), $NVDA hasn’t been able to invalidate that signal. It’s been trapped in a range between roughly $974-$830. On Friday, it shattered that support level.
The quote that never fails to comes to mind when I look at a chart of Nvidia – “A Head and Shoulders formation which fail of completion or produce false confirmations; such developments almost never occur in the early stages of a Primary advance. A Head and Shoulders which does not ‘work’ is a warning that, even though there is still some life in the situation, a genuine turn is near.” – Robert Edwards and John Magee
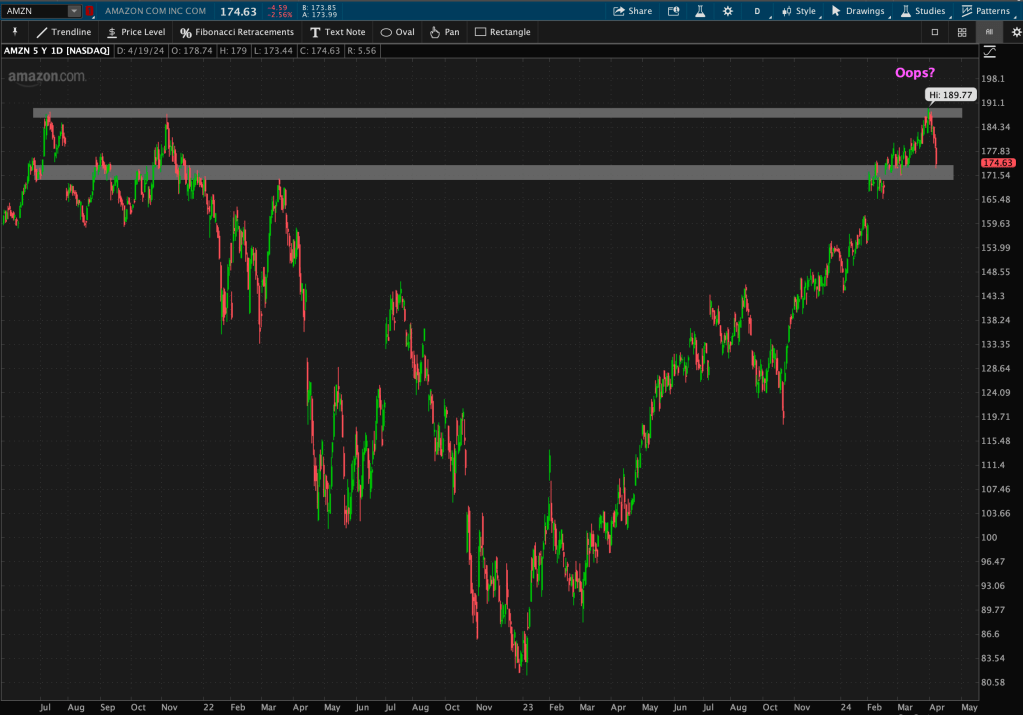
4. $AMZN
Amazon appears to have formed an “Oops” pattern, or a failed breakout, from its prior 2021 highs. It made a new ATH in the prior week of trading, but quickly retreated back to its long-term support zone.
Zooming out, using a weekly chart – it formed a Bearish Engulfing candlestick pattern, which engulfed the last four weeks of trading….
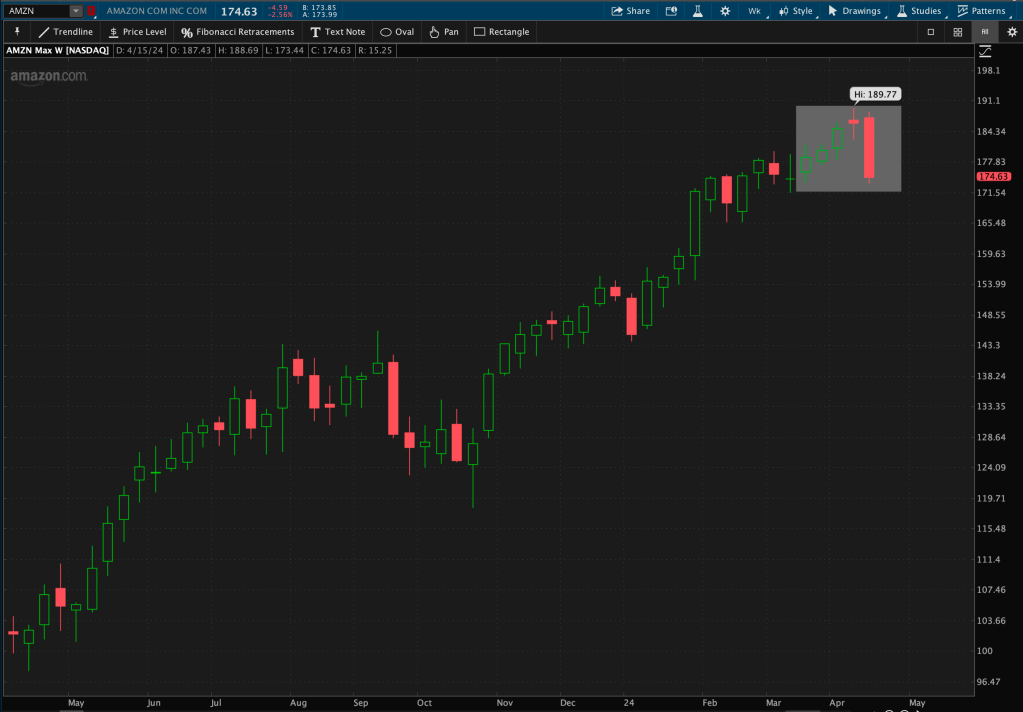
Time to watch for follow-through.
5. $META
Meta seems to adore that support level around $480. I’ve lost count of how many times it’s brushed that level over the last couple of months. Another stage 5 clinger on our hands.

I switched to a line chart to convey the precision of those touchbacks. $META is hovering at this critical level – we will see if it holds or breaks from here.
The next level of support I outlined is around $453, which is the start of the massive support window.

6. $GOOG
Alphabet’s uptrend is still intact.
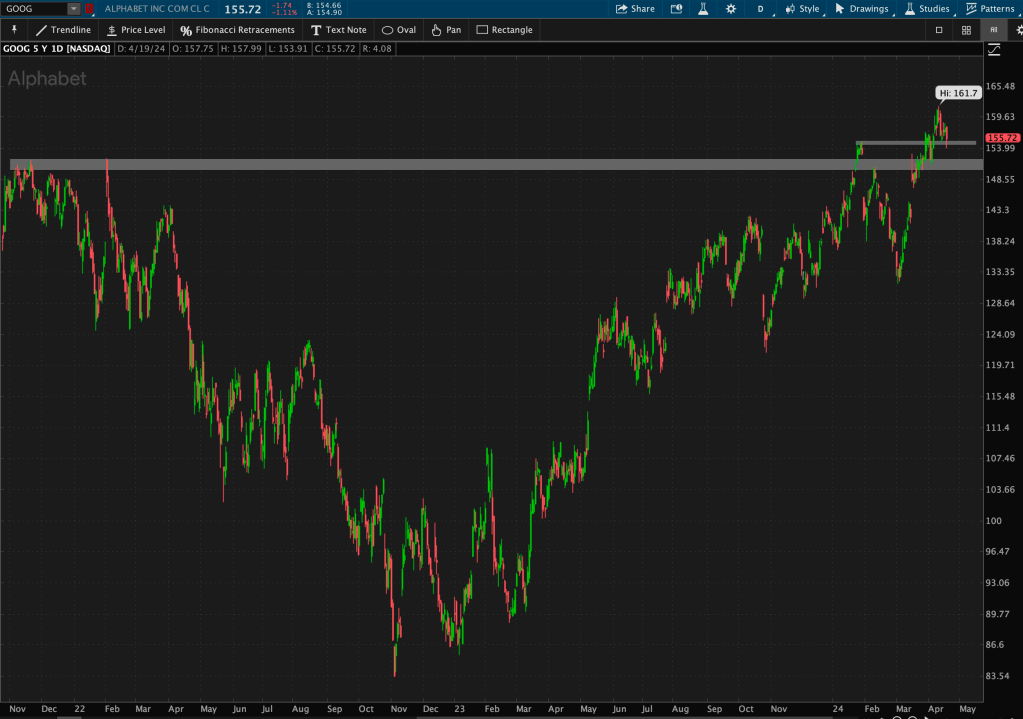
It’s above its 2021 highs, which is an essential support zone.
Zooming in a bit closer, you can see it’s also hovering at another layer of shorter-term support around $155 – January’s highs.

7. $BRK.B
Last but not least, Berkshire. This chart looks a bit different than the rest, and for a number of reasons.

$BRK.B bounced back from two Bearish Engulfing candlestick reversal patterns after it retreated to its valid support level around $400 – a level touched many times.
Most recently, it appears to have formed an “Oops” pattern with a slight support break before a minor bounce to the upside from that level.
Again, just like a couple others we have seen, the support line hangs in the balance for Berkshire. How many more hugs of support will we see?
As you can see, after highlighting the price trends and relative strength relationships, there seems to be a little trouble in paradise with our mega-cap masters.
Will these April showers bring May flowers or will these long-loved favorites be renamed the “Lag 7”?


Leave a comment