By now you’ve probably seen or heard that Gold reached a new all-time high this past week.
Or maybe you didn’t.
Did the parabolic moves in the Technology sector grab your attention instead?
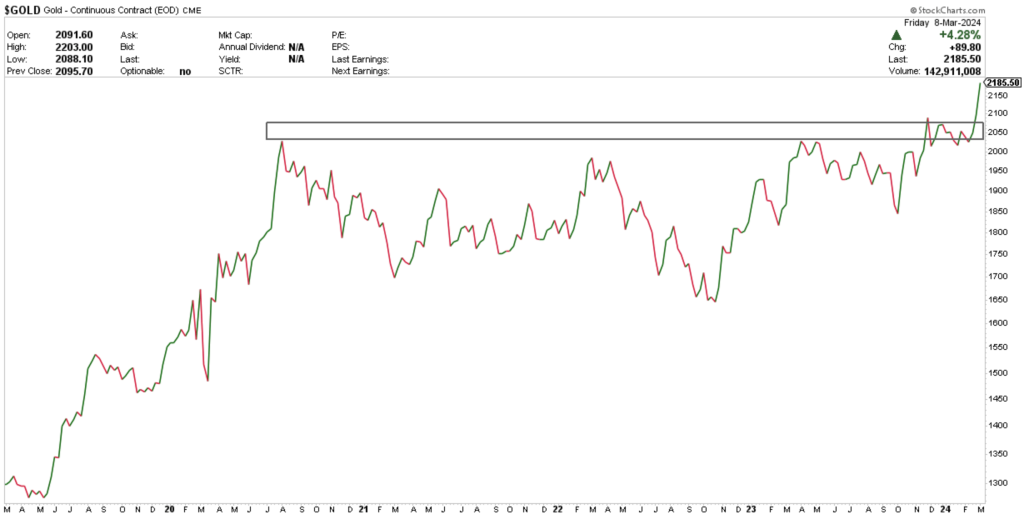
Gold has been in a sideways pattern for the last 3+ years, and more recently, in a coiling pattern as it approached its long-term resistance. It also experienced an early breakout in November of ’23, but then stalled for almost 5 months… Until now.
We could analyze Gold on various time frames all day, but I am more interested in comparing Gold to other asset classes and markets to see if it is outperforming, underperforming, or near support/resistance zones.
Relative strength is one of my favorite techniques I utilize in my strategy. It allows me to compare various asset classes, sector groups, individual equities, etc. If you are new to relative strength, or ratio analysis, read my older blog post here: https://dashcharts.wordpress.com/2024/02/18/relative-strength-ratio-analysis/
In addition to relative strength, I also place a lot of importance on multiple time frames.
That’s exactly what we will look at today across different markets and asset classes.
Gold vs Bonds
This is a 13+ year monthly chart, displaying the relationship between Gold and 20-year Bonds ($TLT). That’s a very large basing pattern – isn’t it?!
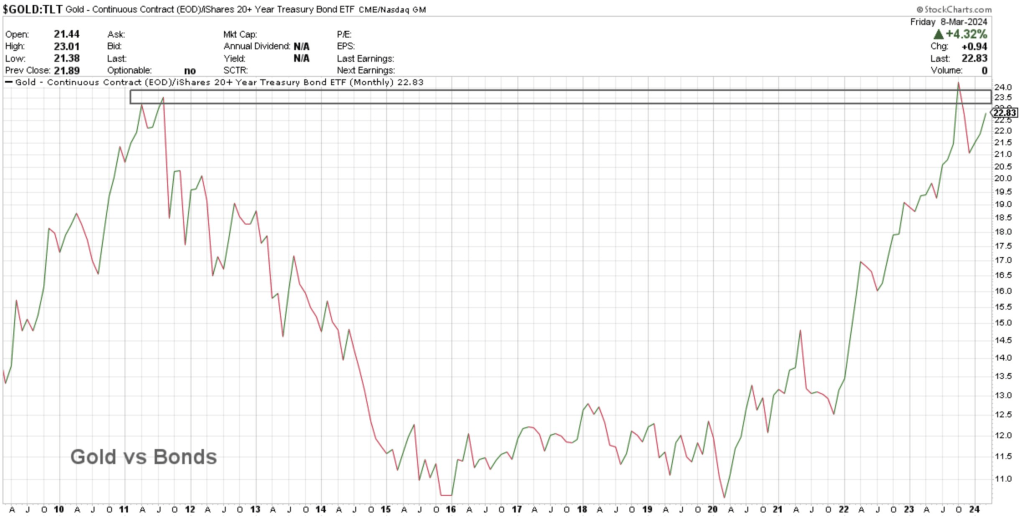
Gold had a failed breakout out of its resistance in mid-2023 before correcting, and now it is creeping closer to that long-term zone.
Since 2020, Gold has been outperforming Bonds – it continues to make higher highs and higher lows.
Therefore, the real question is – does its outperformance finally break long-term resistance?
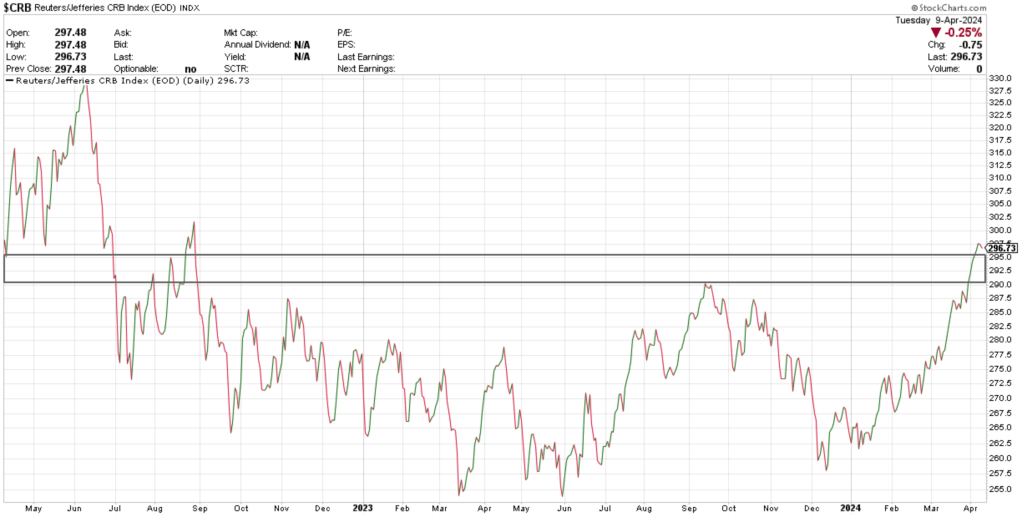
Gold vs Commodities (CRB Index)
The CRB Index is composed of tangible commodities in the agricultural, energy, and metals markets. Thus, it includes Gold. The purpose for this comparison is to compare Gold to a basket of other commodities.
Using a 5-year weekly chart, you can see Gold is also approaching its resistance zone for outperforming other commodities. It typically has a history of leading overall commodity price levels.
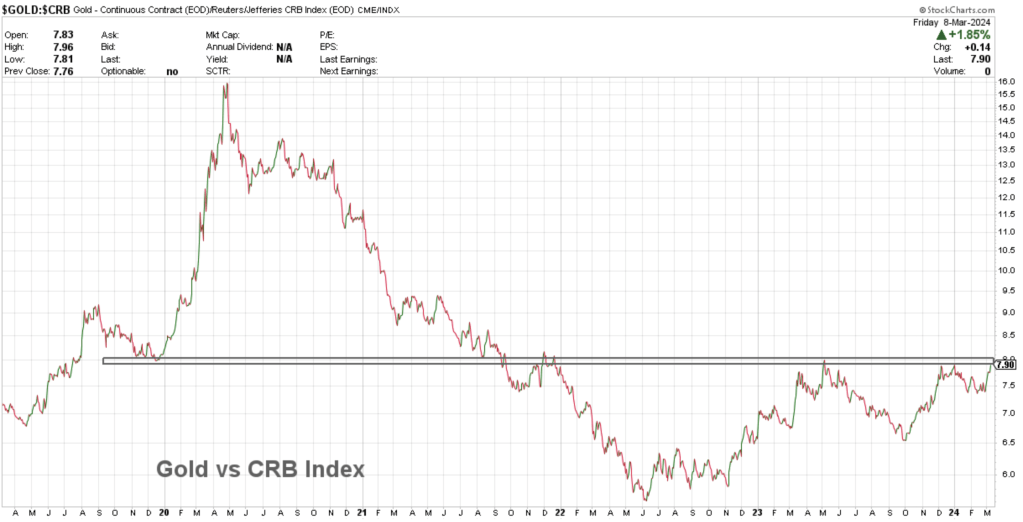
The more times a level is touched, the more significant it is when that level is broken.
In contrast to horizontal resistance, you can see descending trendline resistance was broken early last year.

Now we wait on horizontal resistance breaks to catch up.
Does Gold begin to outperform commodities here?
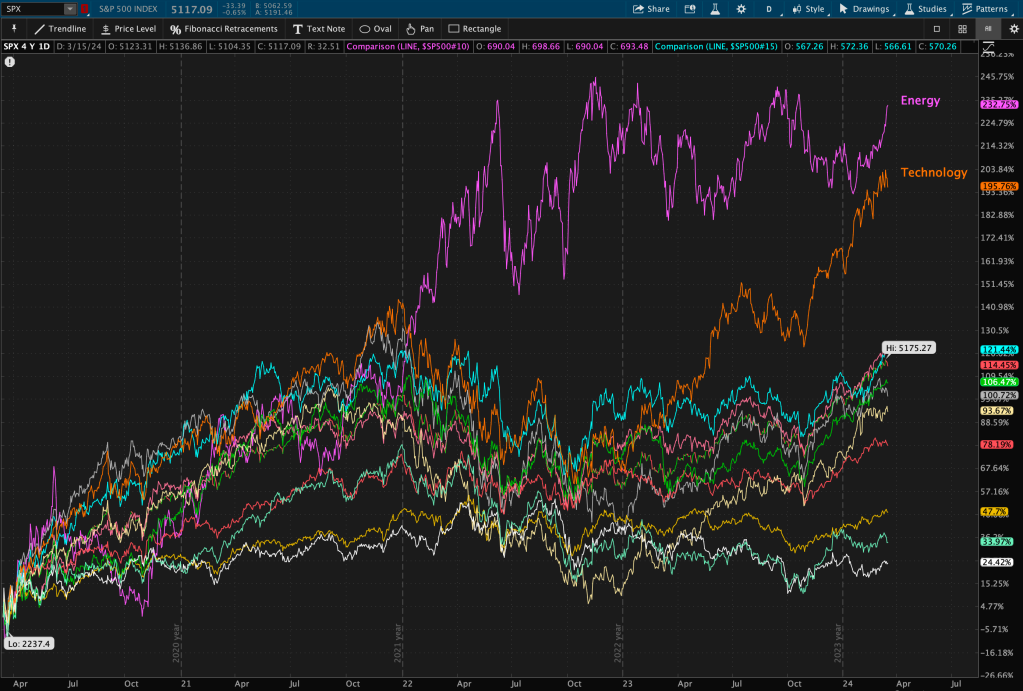
Gold vs Technology (NASDAQ)
The Technology sector has roughly a 50% weighting in the Nasdaq Composite Index. That’s the reason for this benchmark comparison.
Using a 1-year daily chart, you can see a clearly defined level of old support, now new resistance.
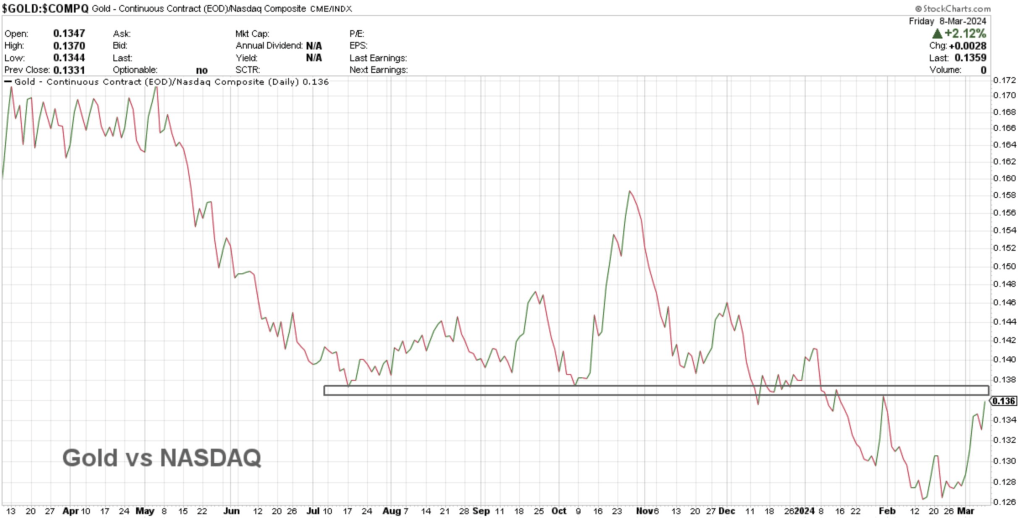
Again, the more times a level is touched, the more significant it is when it is broken.
Does a breakdown in Tech here result in Gold’s outperformance?
Or do we see yet another resistance bounce?
Or does Gold’s uptrend outpace the Tech sector’s uptrend?
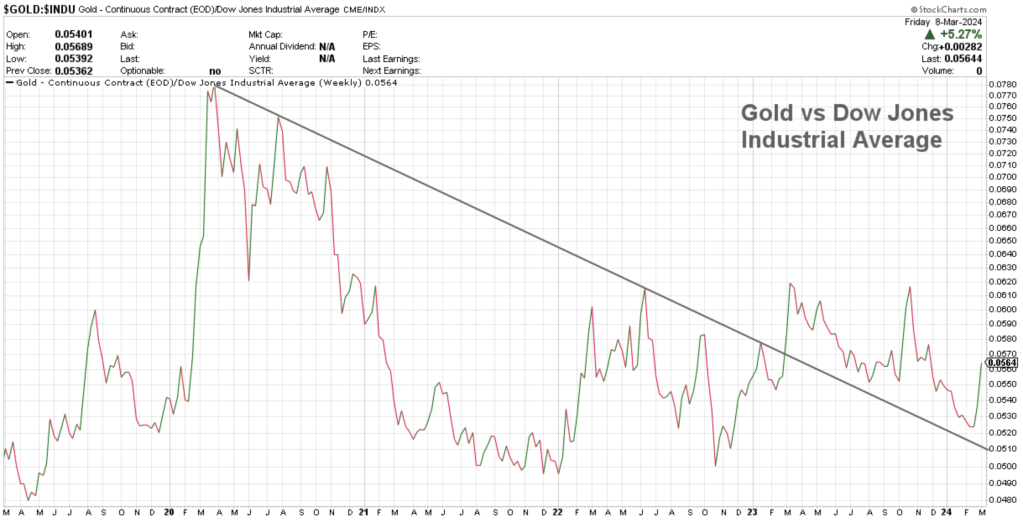
Gold vs Dow Jones Industrial Average
Long-term charts are most important for identifying secular changes in trend. Gold vs Dow Jones Industrial Average is one of my favorite of John Murphy’s “Intermarket Relationships.” This is a 15-year monthly chart of that relationship.

As you can see, this is a valid long-term trendline – it’s been touched many times.
Gold had a failed breakout near the end of 2023, and now looks as though it’s trying to break out once again. Since this is a monthly chart using closing prices, we need to wait until the end of this month to confirm the possible breakout.
Zooming in, using a 5-year weekly chart, we can see that Gold has already broken out of its valid descending trendline resistance.
What does this all mean?
Does Gold begin to outperform arguably the most important index? Does that mean Gold could outperform stocks?
It has a historical tendency to be a hedge or safe haven in market downturns, as it typically trends in the opposite direction to stocks.
This has the power to change investors’ perspective on Gold and other commodities as an investment vehicle, as compared to stocks and bonds.

For now, the secular trend of commodities is still underperforming stocks.
Will this change soon? We will have to wait and see.


Leave a comment