The news is out. We all watched NVDA crush earnings this past week. It seems as though that was this month’s most-awaited event. My colleagues, friends, Uber drivers – Everyone was sitting on the edge of their seat all week. But why?
Why did it seem like this one market event caught every market participant’s attention?
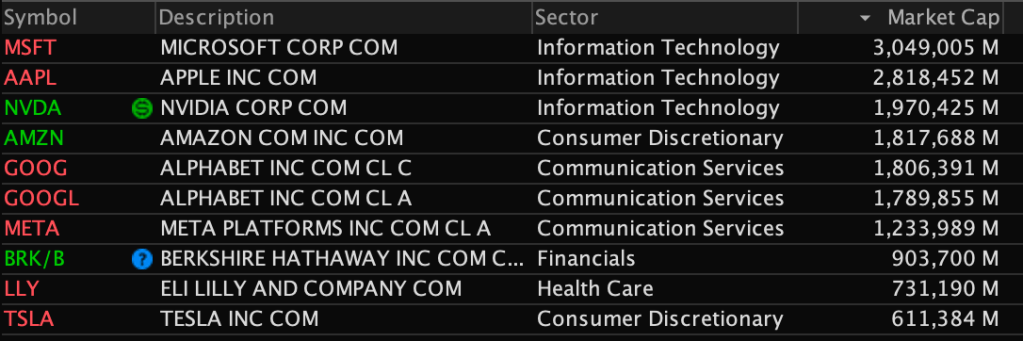
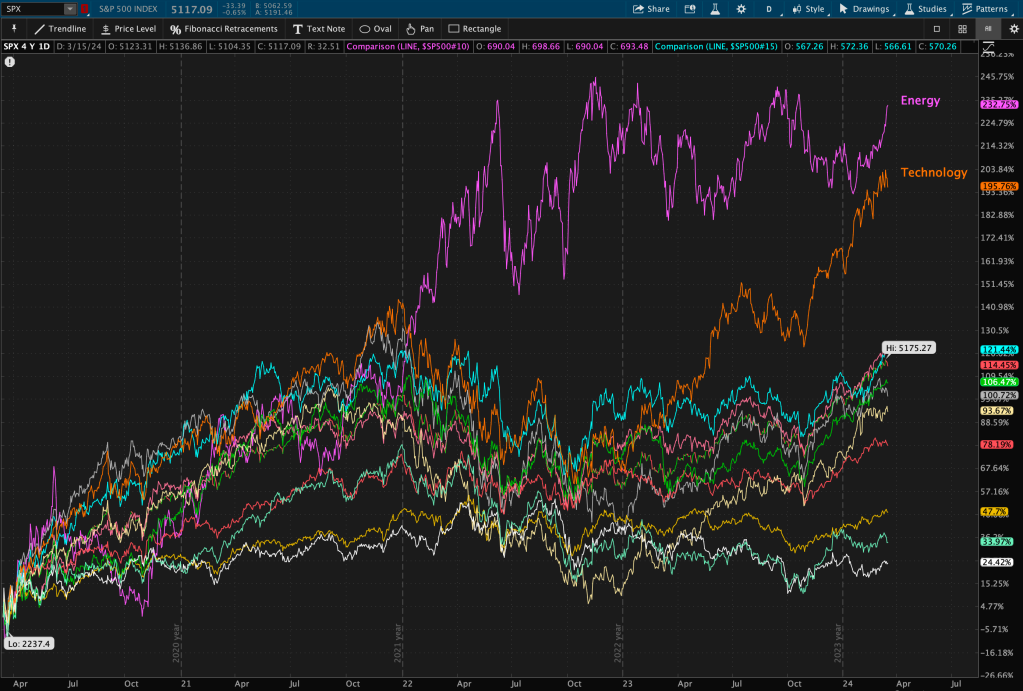
It’s most likely because the market’s overall performance depended on it…. NVDA is the 3rd largest company in the S&P 500, with around a 4.5% weighting. It also has crucial partnerships with other Tech giants, like MSFT – the world’s largest company (7%+ weighting in the S&P) and AAPL, the second largest company (6%+ weighting in the S&P).
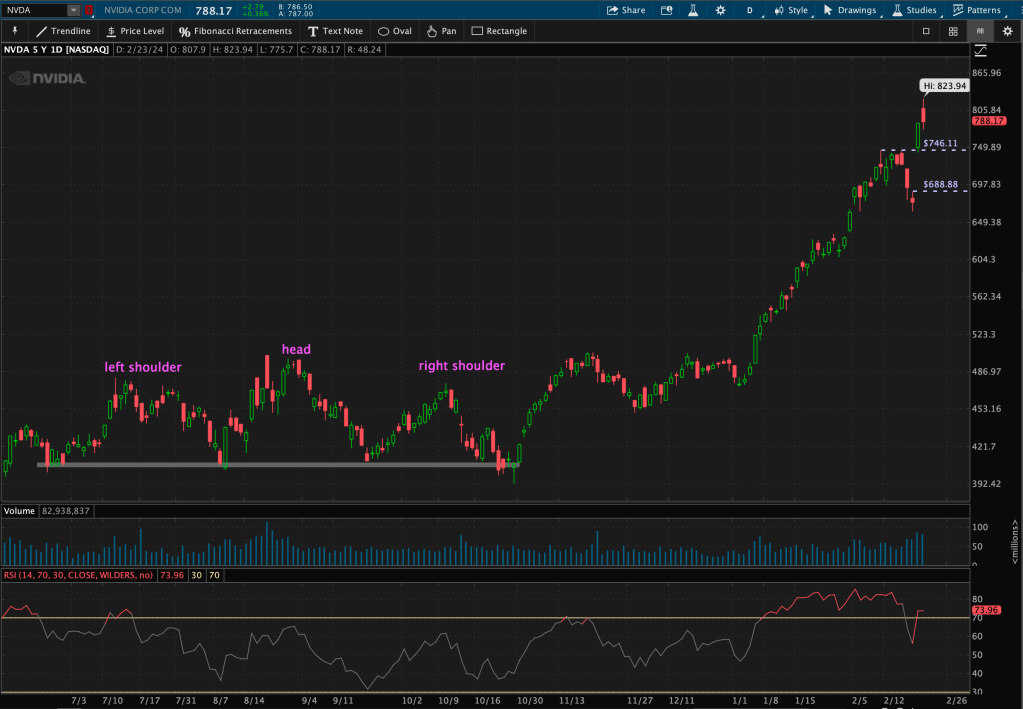
NVDA’s main technical standout that grabbed my attention was the massive Head and Shoulders (H&S) pattern that developed earlier this year. The pattern ultimately failed (which is rare of H&S patterns) after taking over four months to develop.
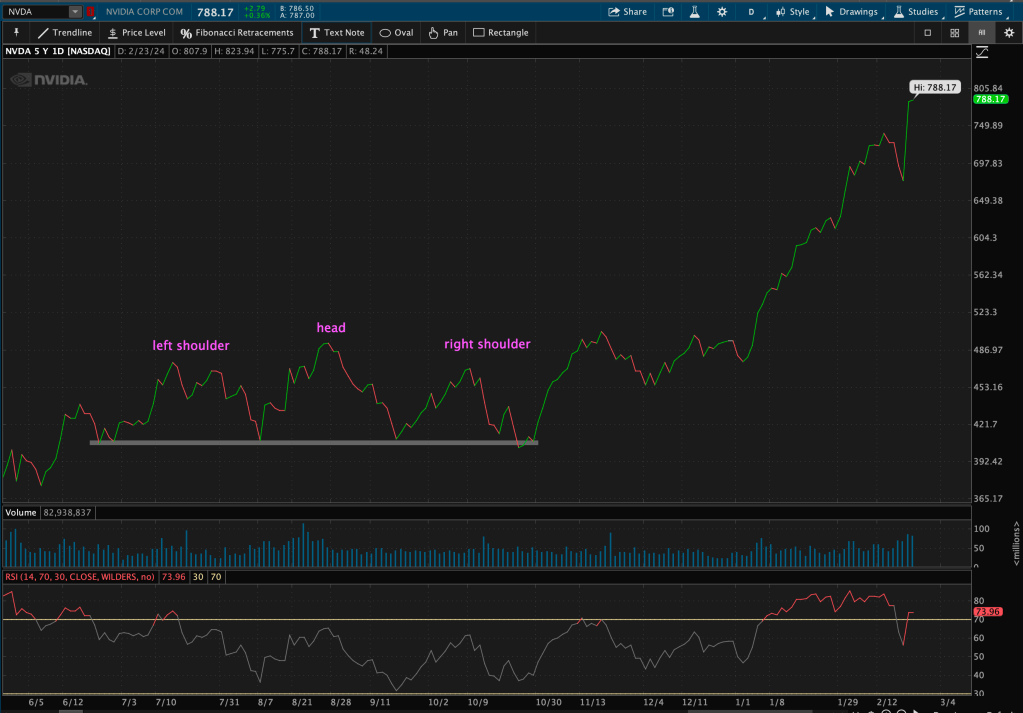
To quote Robert Edwards and John Magee; “A Head and Shoulders formation which fail of completion or produce false confirmations; such developments almost never occur in the early stages of a Primary advance. A Head and Shoulders which does not ‘work’ is a warning that, even though there is still some life in the situation, a genuine turn is near.”
That is the most recent phenomenon that forced me to pay a bit closer attention to NVDA’s trend developments, along with other Mag 7 stocks – especially at that point in the current market cycle.
I focus on three main technical factors when evaluating a stock – trend, momentum, and relative strength. Similar to a game of baseball; three strikes and you’re out.
Over the past few months, and especially since the start of the year, many “Mag 7” stocks have begun to struggle on at least one of these three factors. I will deconstruct each of these factors amongst all Mag 7 stocks.
Let’s start with MSFT.
1. Microsoft (MSFT)
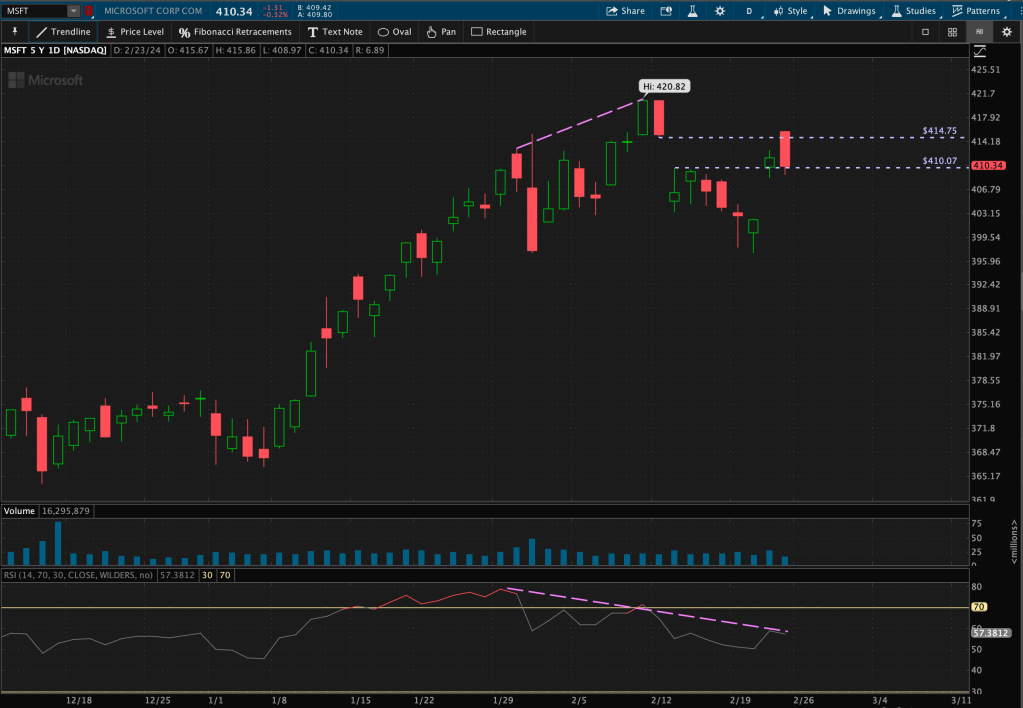
MSFT was in a strong uptrend after completing a few basing patterns, and despite a few minor consolidations, continued suit. In late January, it began to display a Bearish momentum divergence – this occurs when price makes higher highs and the Relative Strength Index (RSI) makes lower highs.
MSFT made a new all-time high (ATH), but with a “Tweezers Top” candlestick pattern. These are two candles that have matching highs and lows; these formations typically occur at market tops. This price action was immediately followed by a gap down in price. Quite a candlestick pattern follow-through!
This past week, MSFT’s price filled that original gap; by gapping up once again to its previous gap resistance level (marked in above image). However, as price action developed over this past month or so, it has begun to mirror a possible Head and Shoulders pattern.
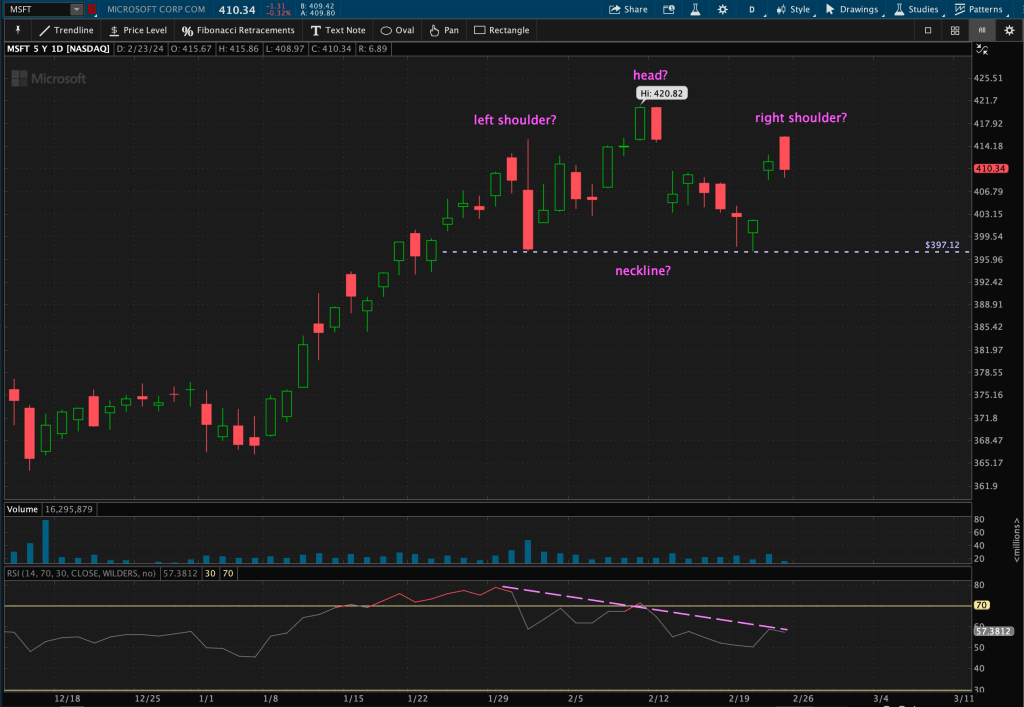
Possibilities: The “head” of the pattern is the ATHs; the “left shoulder” occurred when RSI was extremely overbought at 80 at the end of January; the “right shoulder” with the recent gap up last week, and the “neckline” down at the lows of the past month, around $397 – an area touched twice at the lows of the “shoulders.”
Of course we cannot call this a “confirmed” Head and Shoulders pattern until price breaks 3% below the neckline.
So, we wait. Watch. Then, react.
Why do we wait? Why do we watch? Then react?
Technical analysis is about Reacting to price action – not Predicting it.
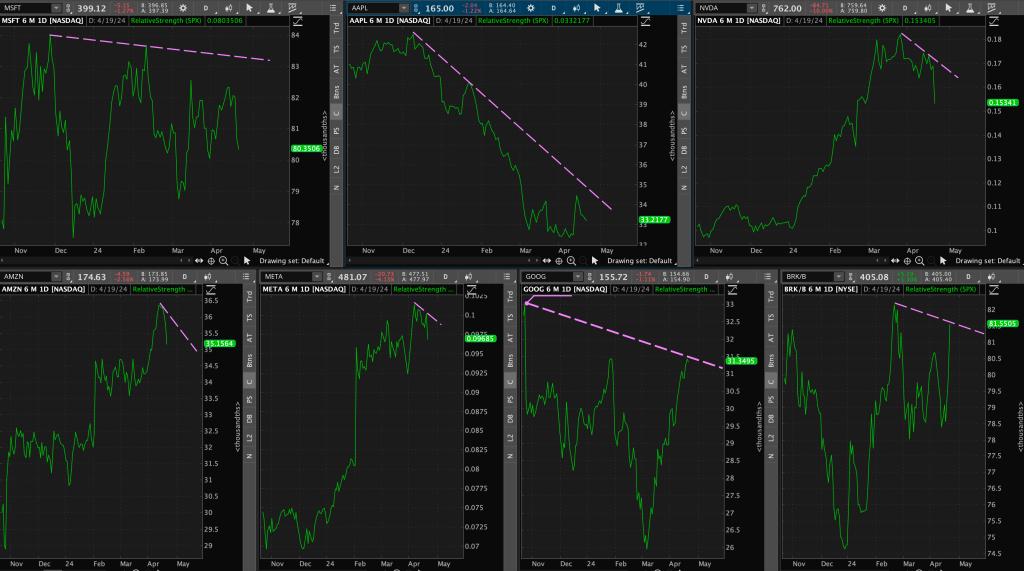
Lastly, let’s look at Relative Strength with MSFT vs the S&P 500 (the benchmark).
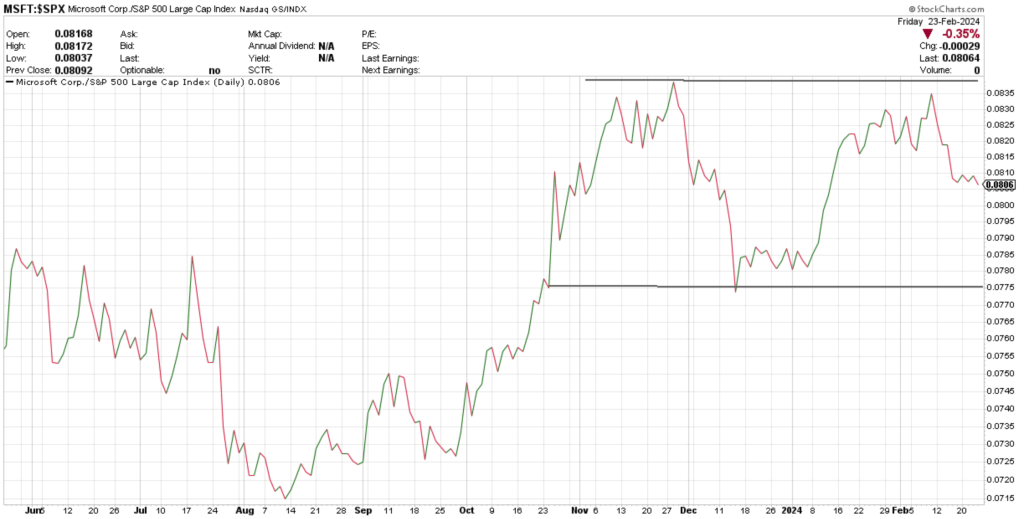
This looks a bit like a Double Top pattern. Its relative strength line is definitely diverging from prior highs in early December, when it had been outperforming the benchmark.
What do they call this in baseball? Three strikes and you’re out?!
If the largest company in the world – and in the S&P 500 and the NASDAQ – is forming a possible H&S pattern (consolidation), has bearish momentum divergences, and diverging relative strength, what does that tell us about the Technology sector or market as a whole?
You tell me.
I guess we will have to wait and see.
Let’s look at the next Mag 7 stock, the second largest company – AAPL.
2. Apple (AAPL)
This has been a fun one to track from pattern-to-pattern over various timeframes.
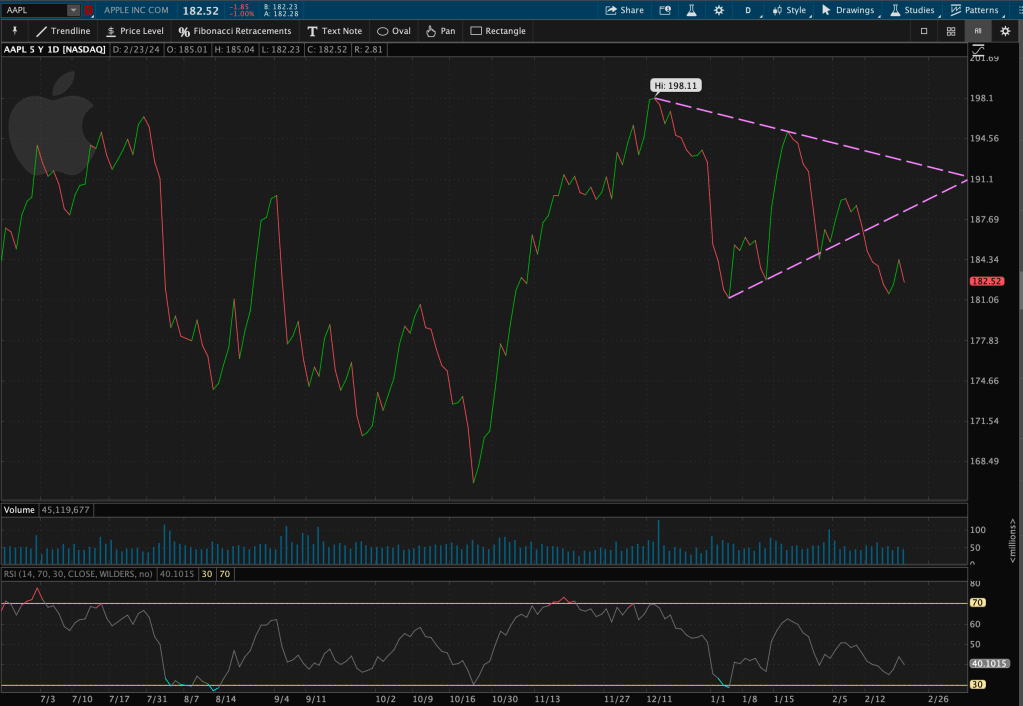
Since its wintery December highs to early February’s consolidations, it had been forming a Triangle pattern.
Recently, AAPL has also broken support of this Triangle pattern.
This pattern support break motivated me to zoom out onto a longer-term time frame. Here’s a snapshot of the last 2.5 years of trading.
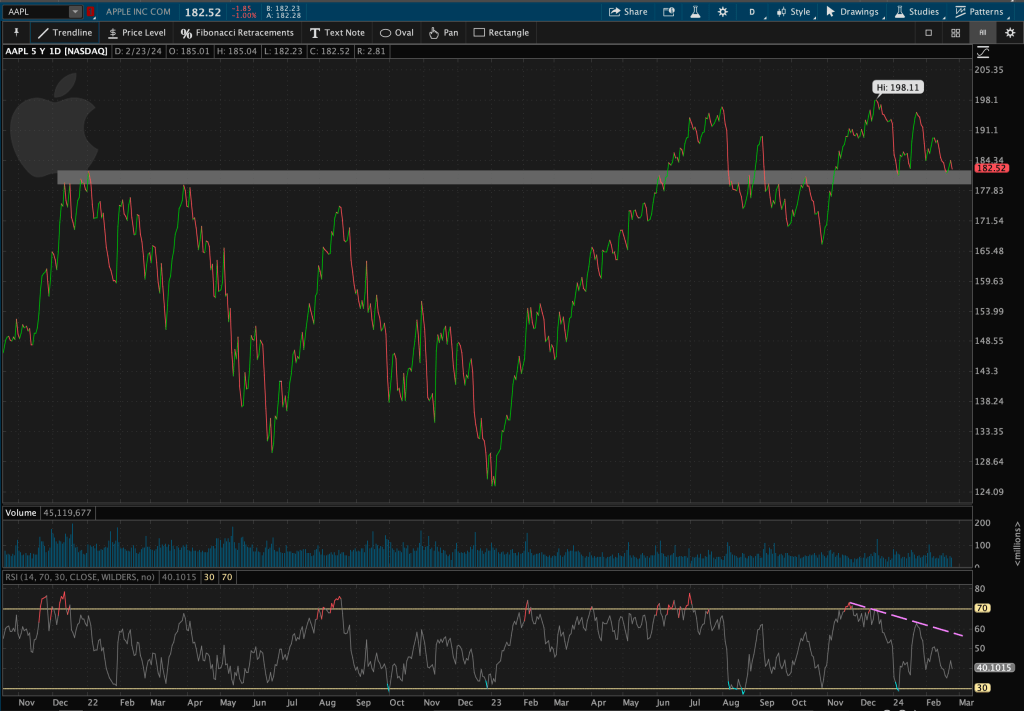
AAPL is hovering just above its long-term support zone – from pre-Bear market highs in late 2021-early 2022. This support zone is around $177-$182. If AAPL cannot stay above its long-term support, this may not bode well for the overall market.
Let’s remember, this leader assumes a 6%+ weight in the S&P 500 and an 8%+ weighting in the NASDAQ.
First, there’s trend, then there’s momentum. Notice how RSI has been making lower highs with price.
Lastly, relative strength.
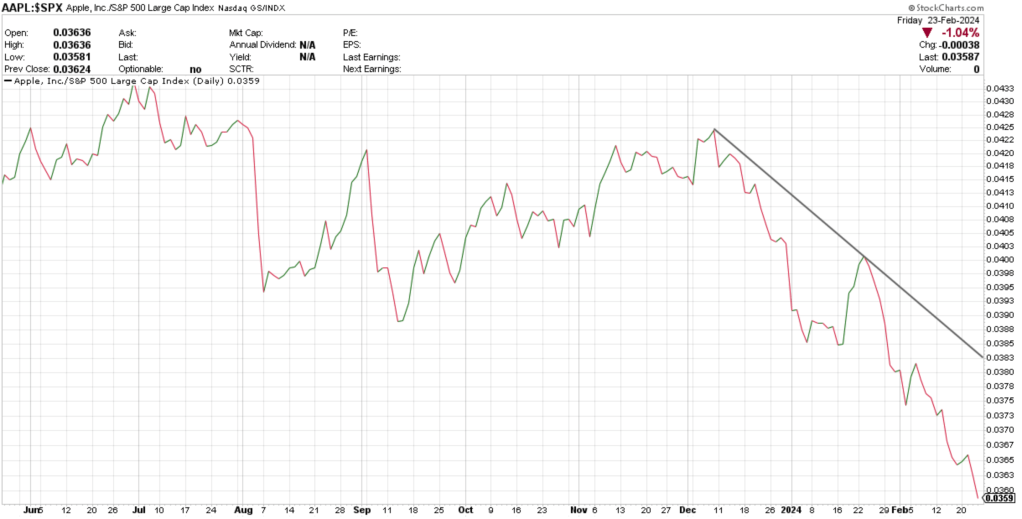
AAPL’s relative strength vs the S&P 500 has fallen off a cliff since the beginning of December. The 2nd largest stock in the S&P and NASDAQ has been underperforming the market for THREE. WHOLE. MONTHS. Concerning?
Three strikes yet? AAPL, you’re almost out…
Next batter up.
3. Nvidia (NVDA)
Revisiting this stock again. Let’s remind you of NVDA’s price action.
Currently, these are the short-term support levels I am monitoring.
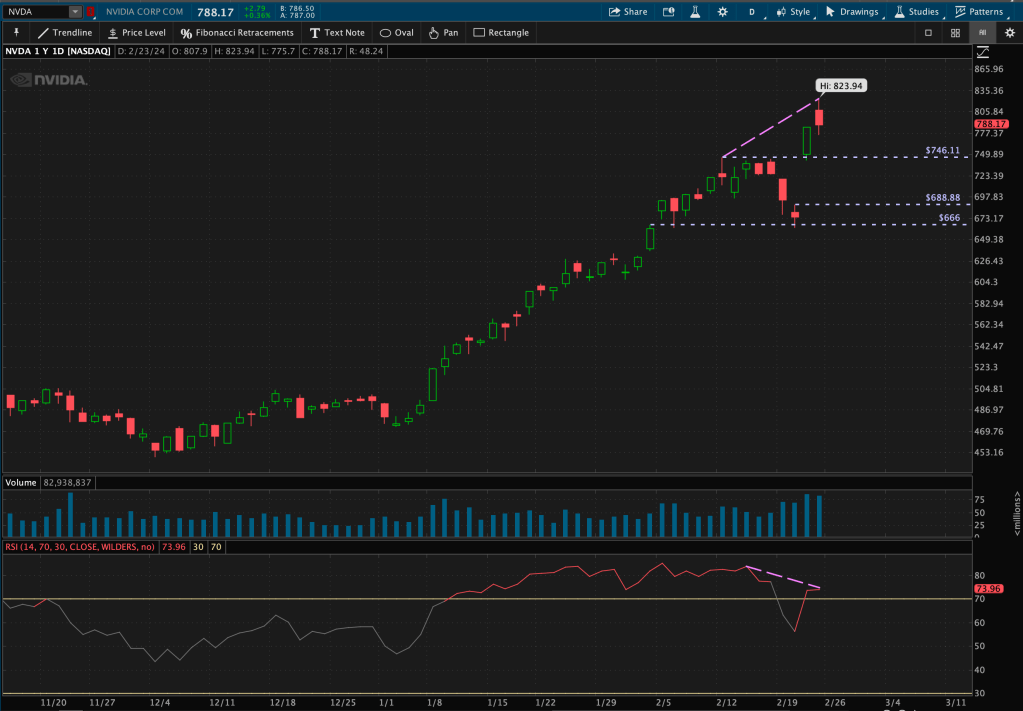
NVDA’s earnings gap-up created a large support zone of around $689-$746. Below that, another level of support resides around $666 – a level touched a few times by price – most recently, swing lows on the 21st of February before gapping up the next day.
While making higher highs, RSI still remains overbought above 70 – a sign of strong momentum – which is what you’d like to see in a stock making new ATHs. There is a slight Bearish divergence in RSI – a slightly lower high as price made a new ATH on Friday.
Lastly, relative strength. This is where NVDA still takes the cake amongst other Mag 7 leaders.
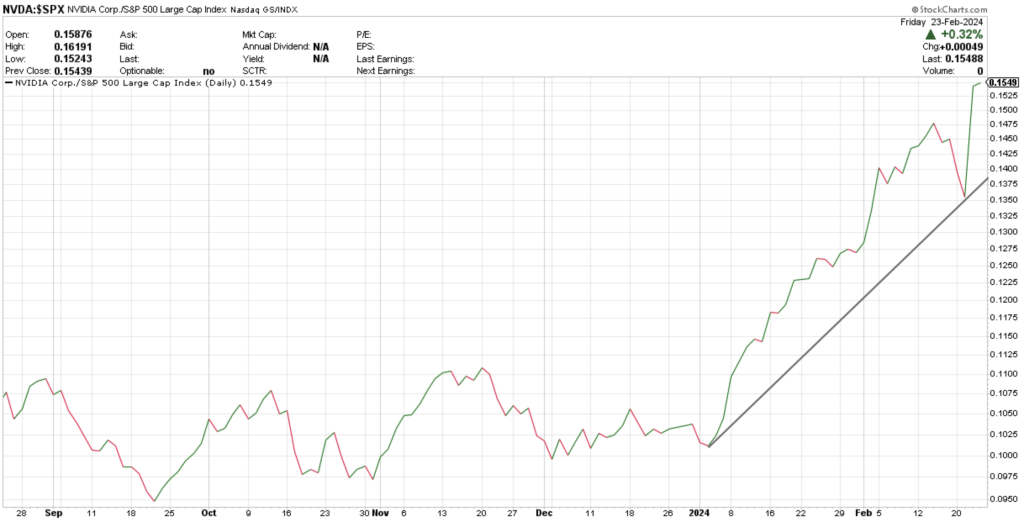
NVDA has been outperforming the market since the beginning of this year, making higher highs and higher lows in relative strength.
Alright, NVDA. Take your victory lap now.
4. Amazon (AMZN)
AMZN is another leader, whose weighting is close to 4% in the S&P 500. AMZN has been stuck in a short-term range (around $167-$175) after it’s recent gap up near the start of February.

That’s a short-term snapshot. Now let’s zoom out and identify some longer-term support and resistance zones.
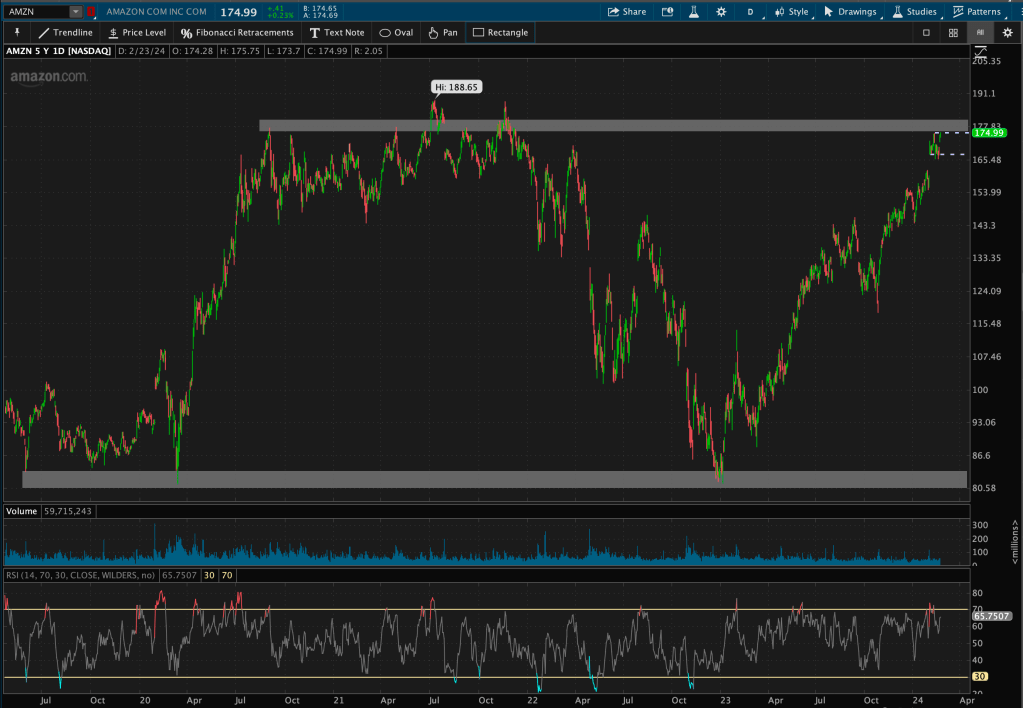
Longer-term resistance tends to lie around $176-$181 – notice how AMZN’s current price has been in a range below this level for almost the entire month. Its longer-term support zone lies around $81-$84.
Next, momentum.
RSI has stayed in a bullish regime, above 50, since the start of the year. Just this week, as price made new yearly highs, the RSI made lower highs, below its “overbought” level of 70. This created a slight bearish RSI divergence.
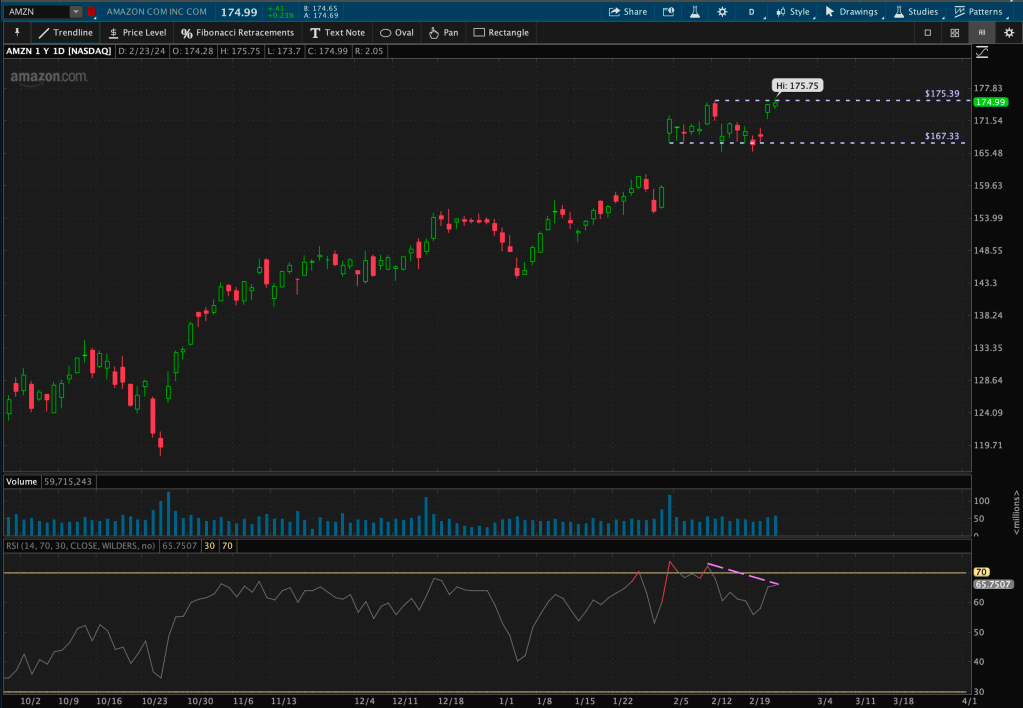
Lastly, relative strength.
AMZN remained in a relative strength consolidation as it market-performed for three whole months. At the start of February, it was outperforming the S&P. Now recently, over the past few weeks, relative strength is weakening.
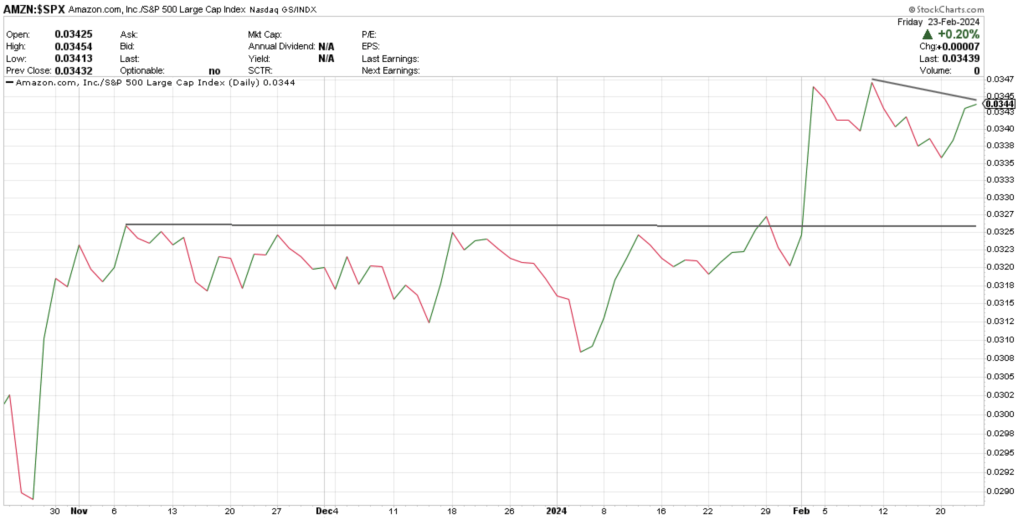
You could say that AMZN has begun to underperform the S&P – its benchmark.
AMZN, you have potential.
Next up?
5. Meta Platforms (META)
META has about a 2.5% weighting in the S&P. It’s chart looks very similar to AMZN’s.

It’s comprised of a range preceded by a gap-up – this range occurring at ATHs.
Most recently, as price made a slightly higher high, RSI made a lower high. I will give META credit here, as RSI still remained overbought above 70, which is what many technicians would still like to see as a stock makes new ATHs.
Lastly, onto relative strength. Once again, running up against some resistance here.
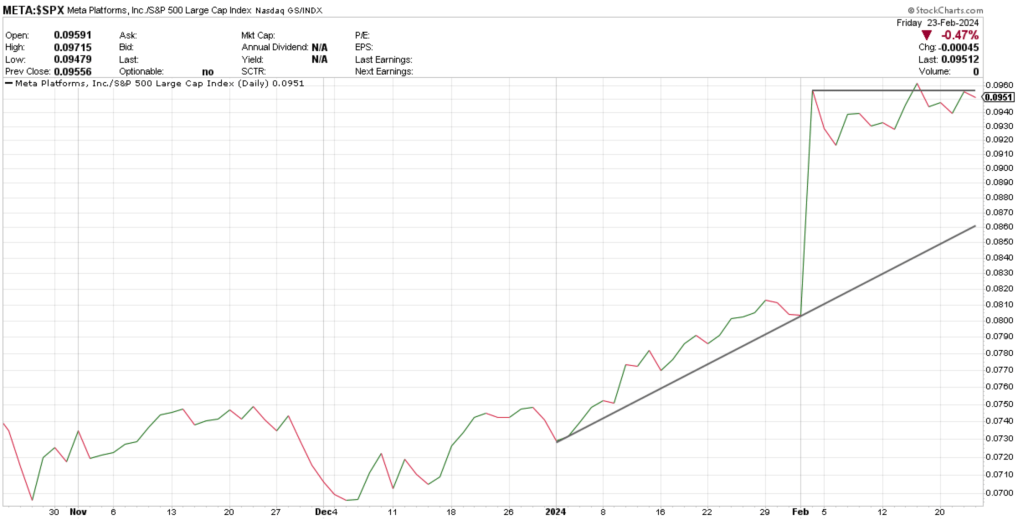
META had been outperforming the S&P at the start of the year and into February. However, ever since, it has been performing with the market – in a relative strength range, you could say.
Again, definitely not terrible, but still, not the greatest we’ve seen. Nevertheless, there’s still some potential.
Let’s wait and see.
Now onto GOOGL.
6. Alphabet (GOOGL)
This one looks a little messier to me. Let’s remember, GOOGL has a 2% weighting in the S&P.

Over the last few months, GOOGL’s price action has consisted of ranges, gaps, and momentum swings.
Sound familiar?
Lions, tigers, and bears – oh my!
The most notable short-term resistance zone is its recent gap down at the beginning of February. GOOGL tried to retrace that gap range – from around $144-$151 – but could only make it as far as $149 before retracing once again. As a result, the remainder of the gap, from $149-$151, still remains short-term resistance.
Zooming out, you can see clearly defined, long-term resistance zones.

While that is a massive, 2+ year Basing pattern, GOOGL is still stuck below its overhead resistance zone ($150-$154) from late 2021-early 2022 highs – which preceded 2022’s Bear market. This is a crucial level for the market in this stock.
Now zooming back in, to dissect momentum.
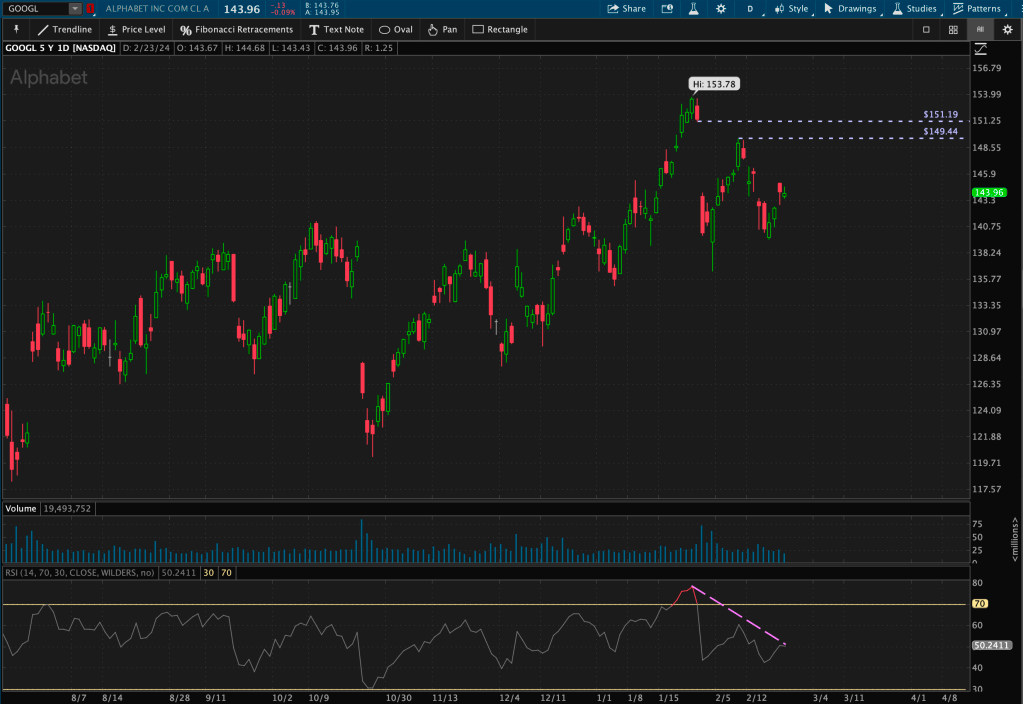
Price is making lower highs and RSI is making lower highs. Confirmation?
Nothing that stands out here.
Lastly, relative strength… Ouch.

GOOGL has been underperforming the market for roughly four straight months. Notice how its relative strength line continues to consist of lower highs and lower lows.
Are you tired yet?
Hang in there for one final Mag 7 stock.
The Berkshire!
7. Berkshire Hathaway (BRK/B)
Berkshire is just under a 2% weighting in the index.
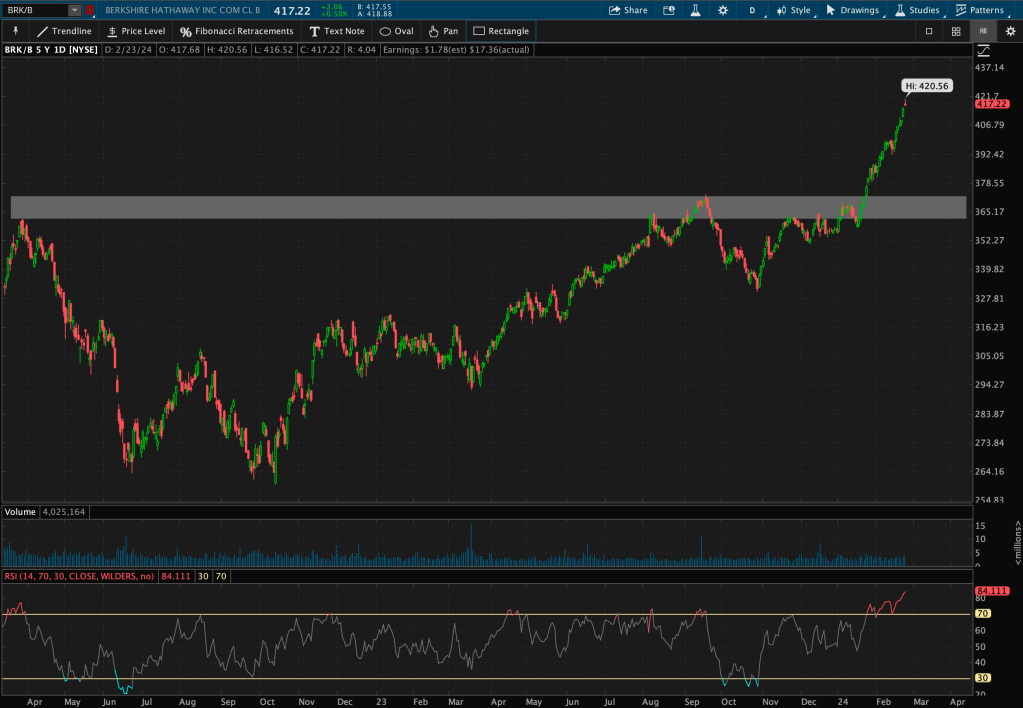
BRK/B’s long-term trend looks fantastic. At the start of this month, it broke out of a 2-year long Basing pattern – a Cup and Handle pattern. Every technician is fond of this pattern.
This breakout zone ($362-$372) acts as its new support.
As far as momentum – stronger than ever. Ranking at an 84 on the RSI, as of Friday’s trading session.

Onto relative strength. Since the beginning of this year, BRK/B has been in a relative uptrend, outperforming the benchmark (S&P 500) – making higher highs and higher lows in the short-term.
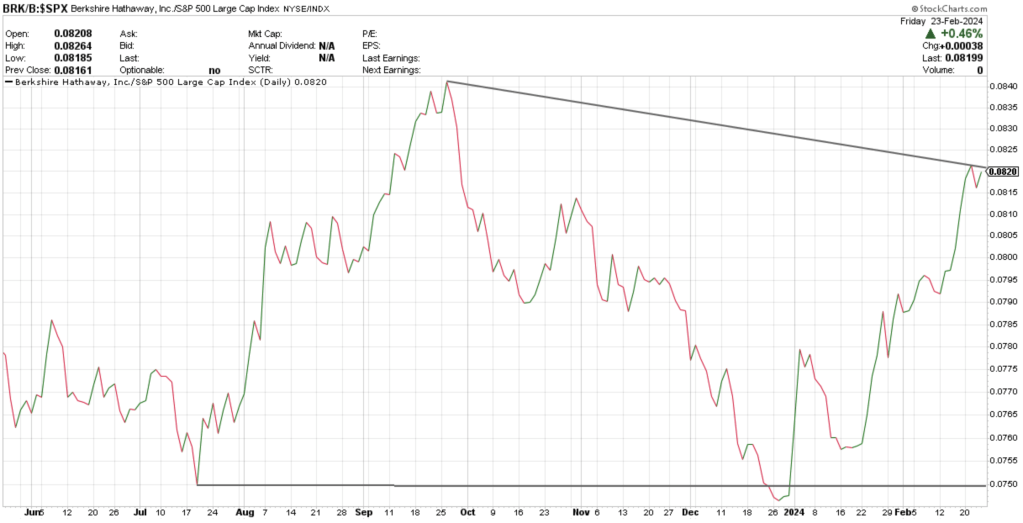
However, looking at a 6-month trend of relative strength, BRK/B is making a lower relative high. This could be a development to watch over the next few weeks to see if a longer-term breakout occurs.
Now what?
There it is – the good, the bad, and the “just ok.”
Most eyes will be on the largest market movers – the two that consume the majority weightings of the index – AAPL and MSFT.
And of course, NVDA.
These three alone take up a near 20% weighting in the S&P 500. If these three stocks do not continue to perform, do you believe the market will?
Is breadth strong enough in the remaining 501 stocks?
Or is it three strikes and you’re out?
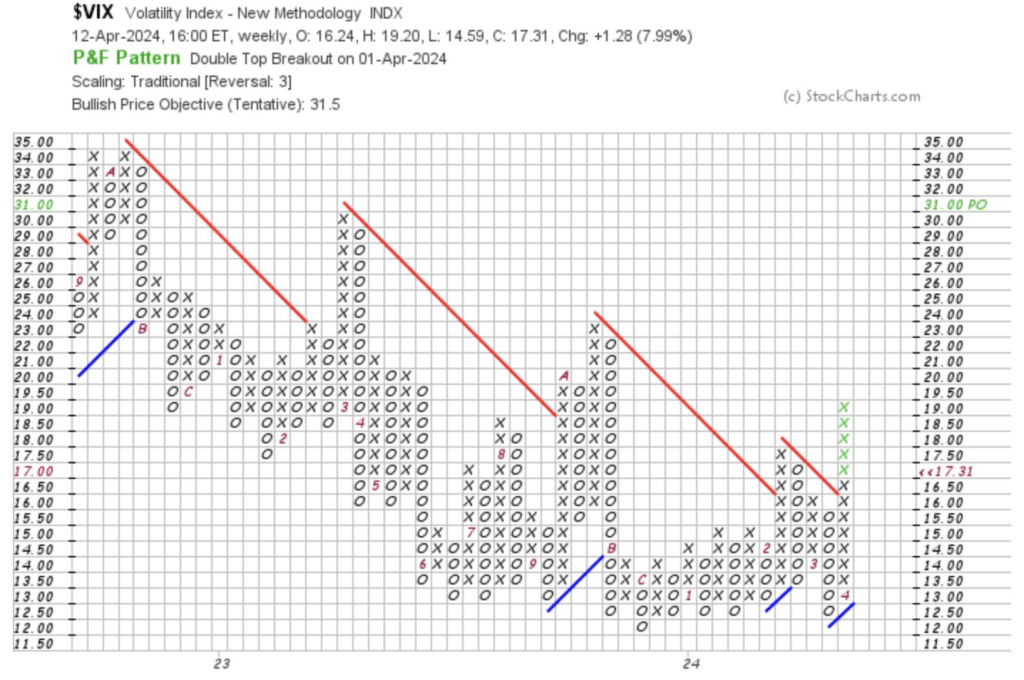
Time and volatility will tell!


Leave a comment