Relative Strength, or Ratio Analysis, is a tool I use in my investing and trading strategy. If you don’t know already, it is a form of momentum analysis – with a goal of finding an asset or security that is outperforming its benchmark. It does this by simple math – comparing the asset in the numerator, to the benchmark in the denominator. How can you outperform your benchmark if you can’t see how your investment is performing relative to it?
Using this process, you can see your investment is outperforming if the line is rising (numerator is getting larger), or underperforming if the line is falling (numerator getting smaller).
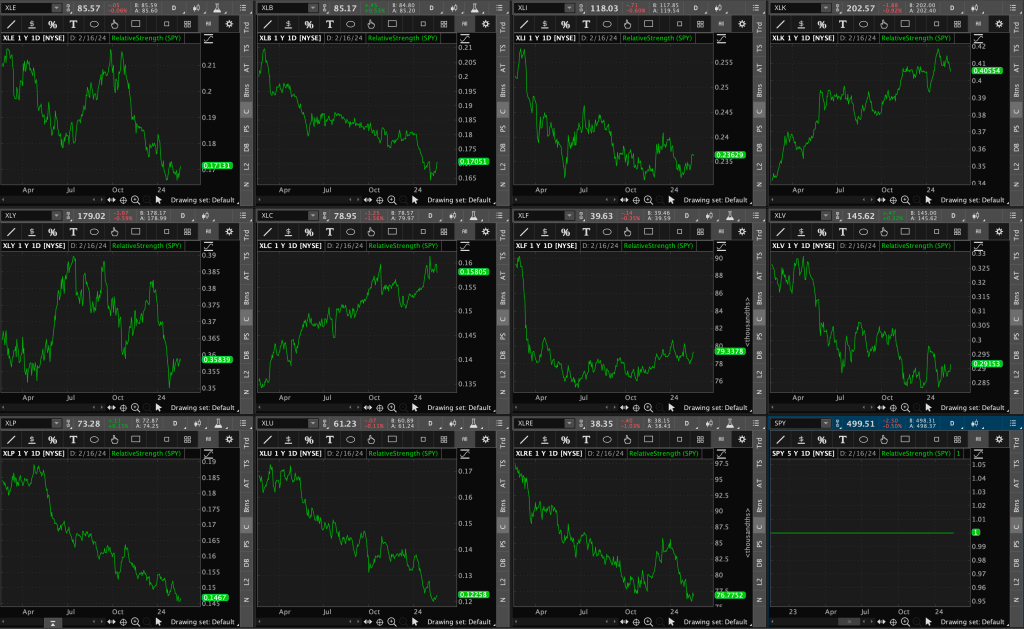
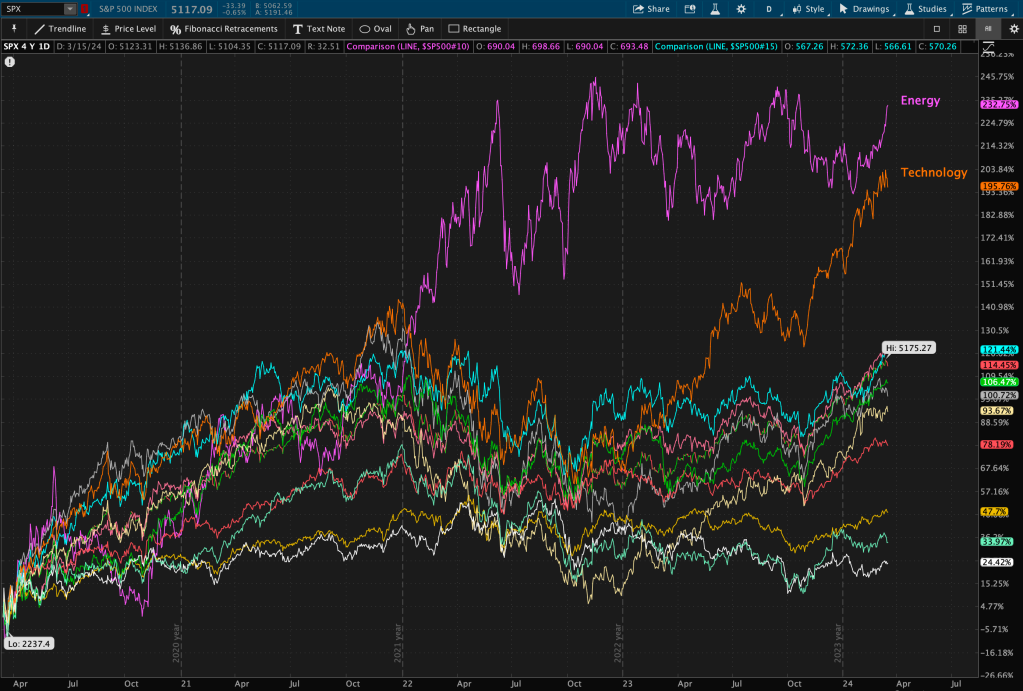
In the image above is a simple daily layout I use. It shows all of the sector ETFs compared to the benchmark, the S&P 500 ETF ($SPY). It provides me with a quick daily snapshot of what groups are outperforming and what groups are underperforming. I utilize this technique across various time frames as well.
Using this snapshot of a 1-year chart (longer-term time horizon), I can clearly see the following:
- Underperforming sectors on a 1-year basis (line is falling) are Energy, Materials, Healthcare, Industrials, Consumer Discretionary, Consumer Staples, Utilities, Real Estate.
- Market-performing sectors on a 1-year basis (line is flat) is Financials.
- Outperforming sectors on a 1-year basis (line is rising) is Information Technology and Communication Services. Those two have clearly been the leaders.
Now this is the beauty of technical analysis… it works on various time frames and on various asset classes.
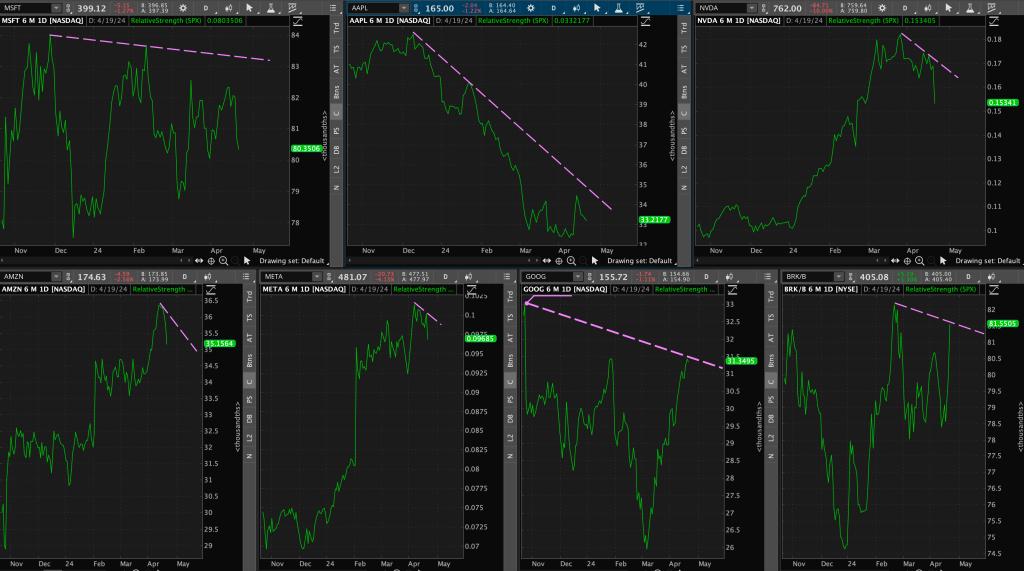
Switching from long-term to a shorter-term perspective, now looking at the last month of momentum, you can see the tides are changing…

Over the last month, I’ve noticed many changes happening in the market; especially relative strength rotation to new sectors. Sector rotation is completely normal. Certain sectors will outperform at different phases of the financial cycle. Funds constantly flow from sector to sector, and this is one strategy that will help you spot when those changes begin to happen. So what is actually going on here?
Let’s take a closer look at the groups catching my eye….
The most notable change here seems to be Information Technology ($XLK) losing steam – and losing it quickly.

Technology has been in a relative downtrend over the last month, and just broke another level of support this past week.
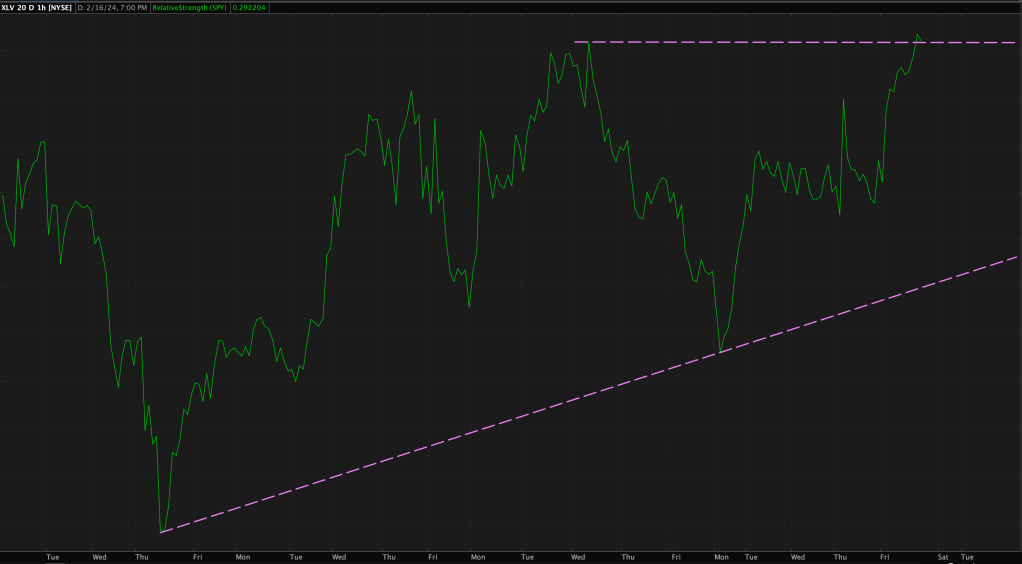
Let’s talk about some areas of strength and outperformance…
First up, Healthcare ($XLV). At the end of this week, Healthcare seemed to break its resistance after being in an uptrend over the past month. Does this strength continue into this week or does it form a Double Top here?
Now Energy ($XLE) – we have a bit of a base breakout here, along with a Double Bottom pattern. This doesn’t surprise me given that interest rates have also moved upwards this past week. Energy prices and rates have had a strong positive correlation.

Onto Materials ($XLB), we are nearing resistance once again after a strong couple weeks.

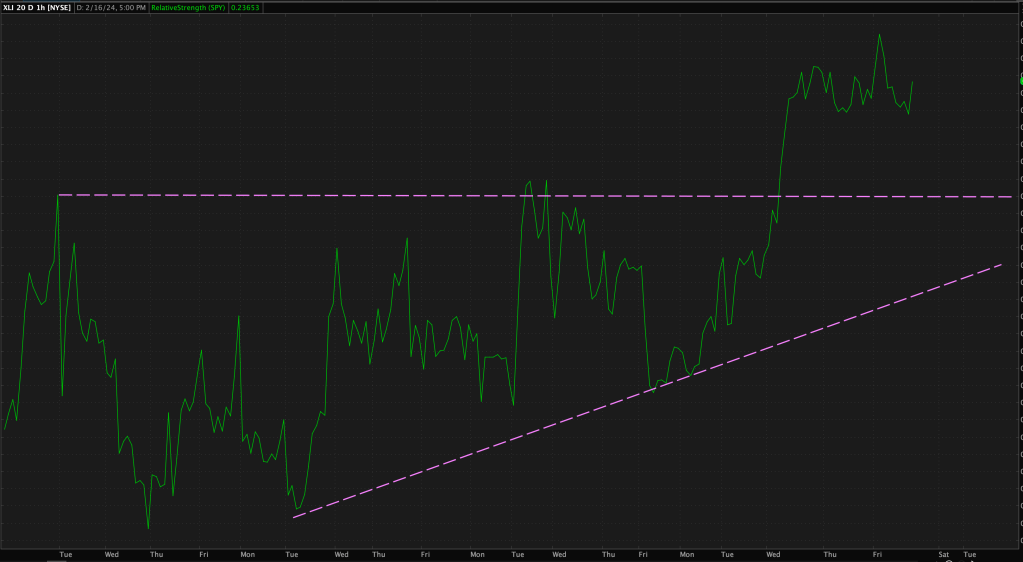
And lastly, Industrials ($XLI), with a strong relative strength resistance break over the past week.
Why is looking at near-term trends and relative strength so important as compared to just looking at a longer time horizon?
You can spot changes and rotation happening in the markets as they are happening. It allows you to pivot your strategy and tactics along the way.
What do these changes and rotation tell us about which stage of the cycle we are in?
The biggest takeaway here with these sectors (Materials, Energy, Healthcare, Industrials) outperforming, or breaking out, is that these are the areas of the market that tend to outperform at the end of the Financial Cycle. In other words, they will outperform in the “Late Expansion” phase of the Business, or Economic Cycle as well.
Relative strength is just one of the tools I use in making my own investing or trading decisions, and it will be something I continue to monitor this week, along with other market factors.


Leave a comment