One of the most important things we learned as technicians is to apply a “weight of the evidence” approach to ultimately be able to make a call. The weight of the evidence approach allows you to make a list of all of your “Bull” factor evidence, and all of your “Bear” factor evidence in the market in which you are analyzing. “Making a call” lends itself to deciding whether you are bullish or bearish based on that evidence, and deciding what you are going to do about it.
So, let’s talk about the evidence….
Divergences
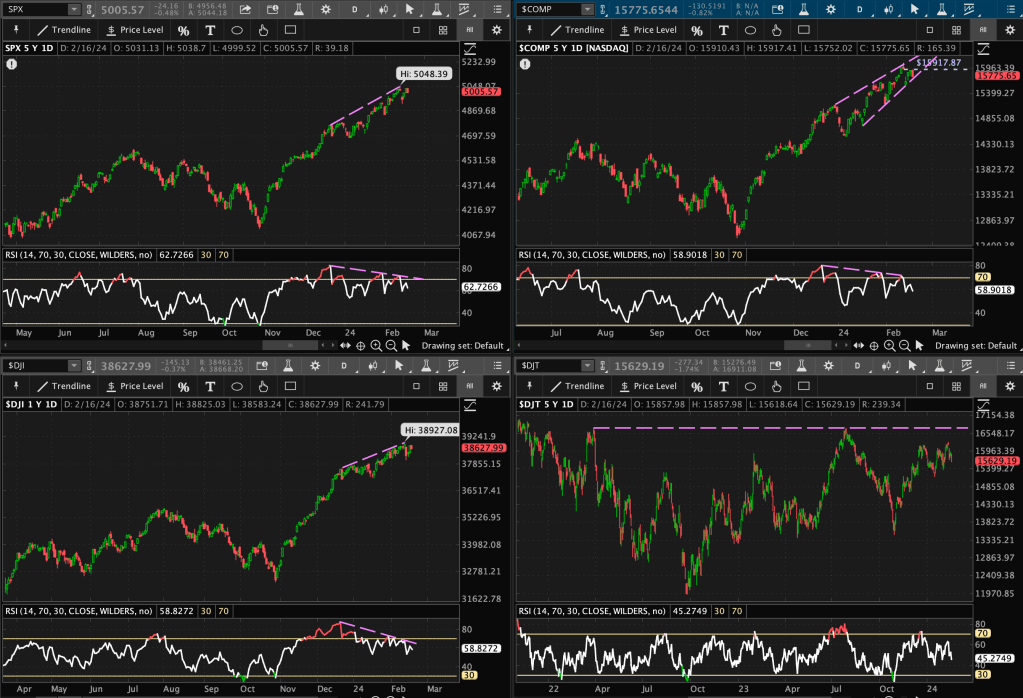
First up, Momentum Divergences. To identify momentum divergences, I use the 14-period Relative Strength Index (RSI). Some technicians use RSI to analyze overbought vs oversold levels, but I use it mainly to identify divergences. A divergence occurs when the indicator is not moving in the same direction as price.
For example, a Bearish Divergence would be price making higher highs, but the RSI indicator making lower highs. You can see in each of the major indexes on the daily chart, all are making momentum divergences (S&P, Nasdaq, Dow Industrials, & Dow Transports).
Market Breadth
Now onto Market Breadth. This is a technique used to gauge the strength, weakness, or participation in the overall market.
My favorite indicators are the percentage of S&P 500 stocks above their 200-day simple moving average (SMA), the percentage of S&P 500 stocks above their 50-day SMA, and New 52-week highs vs New 52-week lows (and even tracking these independently).

As you can see here, over the last 14 months, we have reached levels of both support and resistance. Most recently, a resistance bounce in mid-December of this past year; roughly two months ago. “Resistance bounce,” meaning that the market reached an extended level of the percentage of stocks trading above their short and longer-term moving averages, and then that number declined.
This is striking to me, especially recently, due to the fact that we’ve been making new all-time highs (ATHs) in many of the major indices. However, I am noticing that broader market participation isn’t agreeing.
Relative Strength
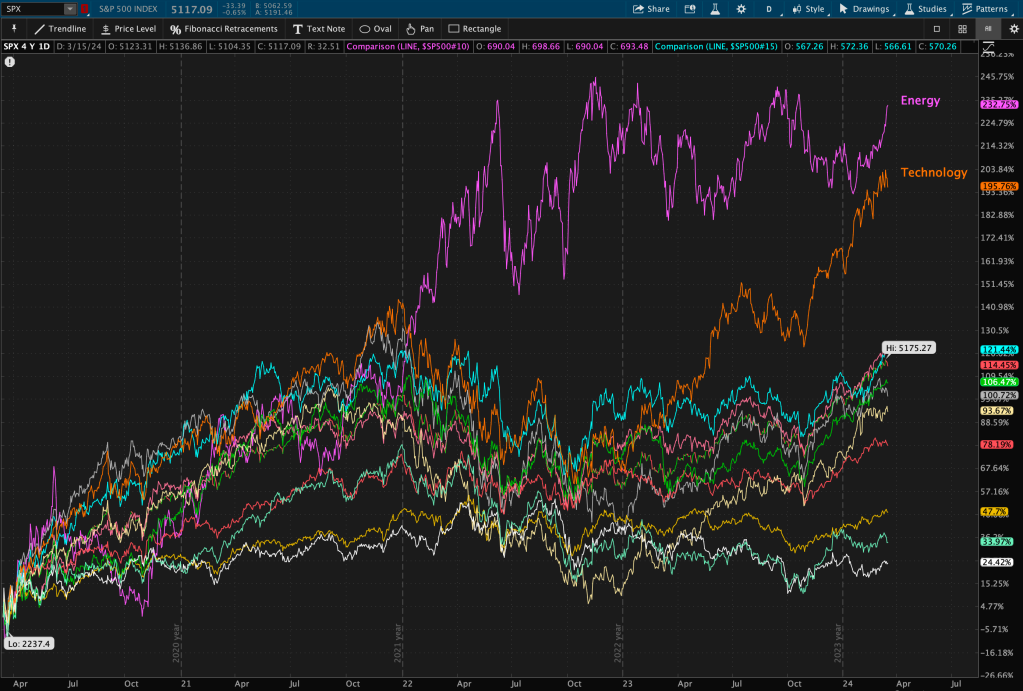
This next one is fun. I shared this chart setup of the last month of relative strength relationships across all S&P 500 sector ETFs vs SPY in my other post.
You can see that Information Technology has recently broken downward, and other groups, such as Energy, Materials, Healthcare, and Industrials have began to break upward.
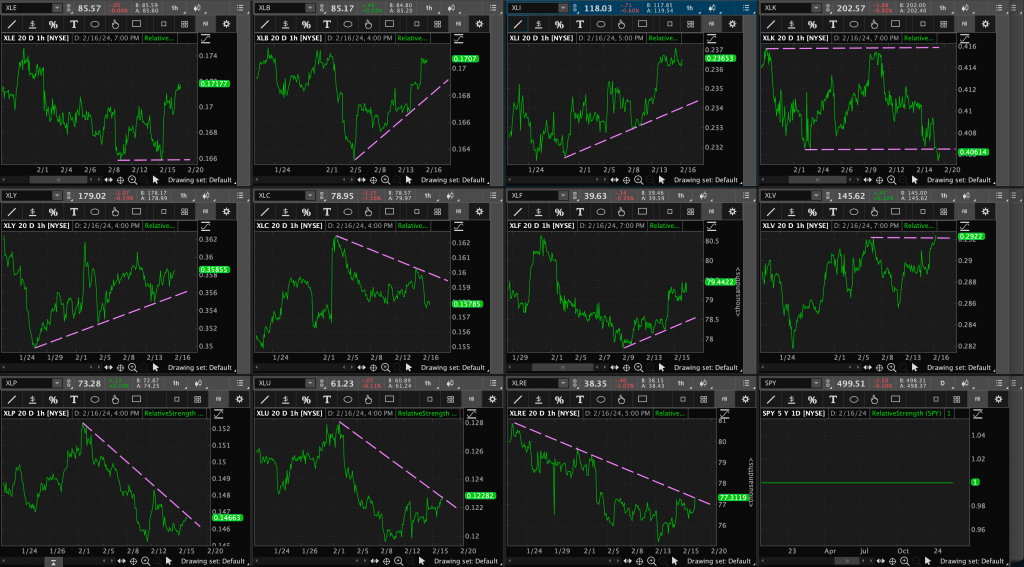
I utilize the relative strength technique in various ways; a stock vs the index, across intermarket relationships, or from sector to sector.
This chart is one of my favorites. It compares two sectors, Consumer Discretionary vs Consumer Staples.

Why would I choose two random sectors to compare? Consumer discretionary is known to be a “risk-on” sector; this sector is known to outperform at the start of a bull market or expansion phase of the financial cycle. This is when consumers have discretionary income to spend on goods and services within the economy.
Consumer staples is known to be a “risk-off” sector; this sector is known to outperform in bear markets or in recessions. This is because we, as consumers, will always spend money on food, toiletries, etc. no matter what. Those are our essentials.
You can see the last time the valid trendline (more than 2 touches of the trendline) between this ratio broke; in our last bear market that began at the end of 2021 and into the beginning of 2022. Consumer discretionary began to underperform consumer staples.
Does this look familiar? This relationship seems to be carving out another valid trendline moving into this year.
How soon until it is broken?
Dow Theory
Lastly, the averages must confirm!!! This concept was designed by Charles Dow, where he defined six principles of markets. One of them being, “the averages must confirm.”

This means that if the Dow Jones Industrials Average ($DJI) is breaking out to new highs, the Dow Jones Transportation Average ($DJT) should follow suit.
Some technicians will debate this because of the technological changes over the last 100+ years in how we transport goods across the country, but I still believe it reigns true. If we are producing goods, we still need to keep pace with transporting those goods in a healthy economy.
You can see here the last time the two diverged preceded the bear market in 2022. By “diverged,” I mean the Transports made a lower high while the Industrials made a higher high.
Does that look familiar to what we are seeing with the indexes now?
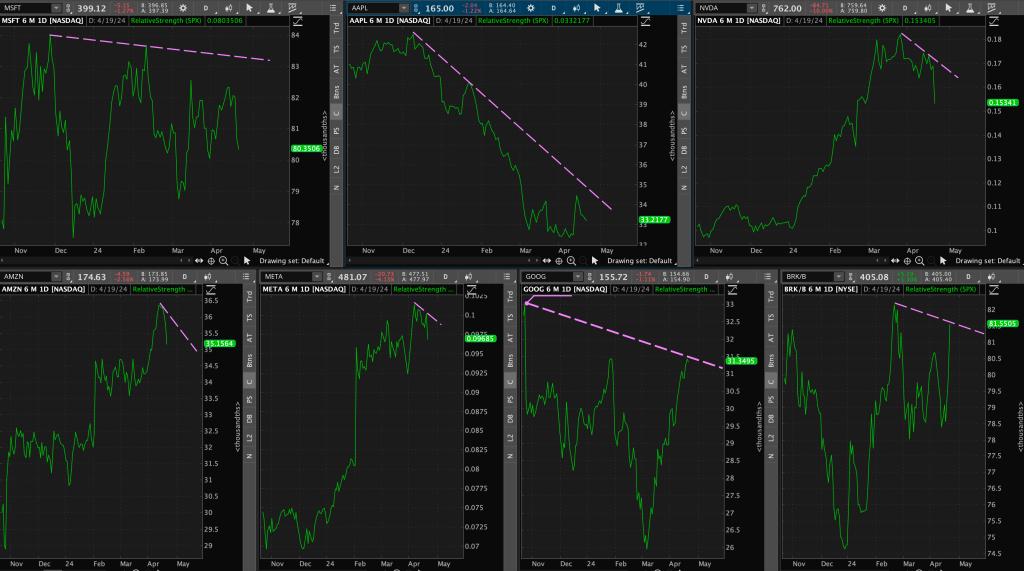
Now I could go on and on with more evidence, such as intermarket relationships and Mag 7 performance… but I will just stop there. I may save that for another post.
The call that I am making here is that we may be in for a bumpy ride. Buckle up!


Leave a comment